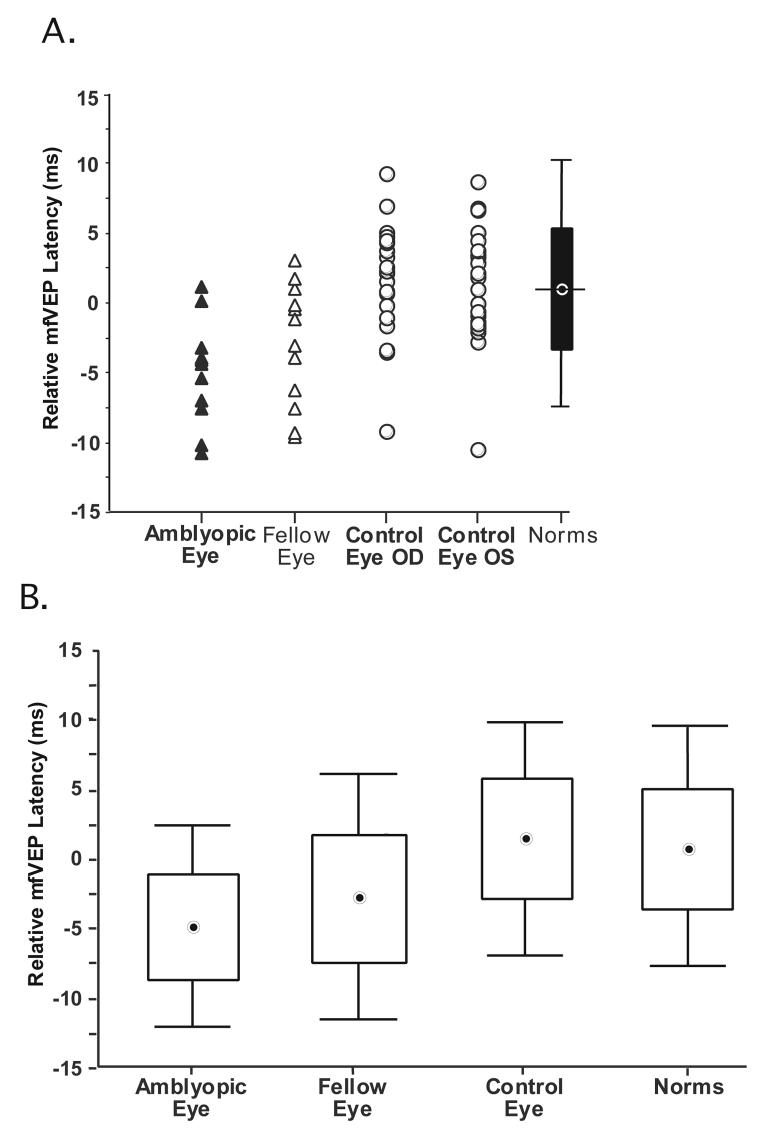
Figure 5.
A. The relative mfVEP latencies for 12 amblyopic eyes (filled triangles), 12 fellow eyes (open triangles), 23 right and 23 left eyes (open circles) of age-similar control subjects. The box plot shows the mean of the normative group (horizontal bar) ±1 SD (box) and ±1.96 SDs (vertical line). B. Box and whisker plots showing the mean latency values ±1.96SD for the group of 12 amblyopic,12 fellow eyes 23 control eyes and 100 eyes of the normative group.

