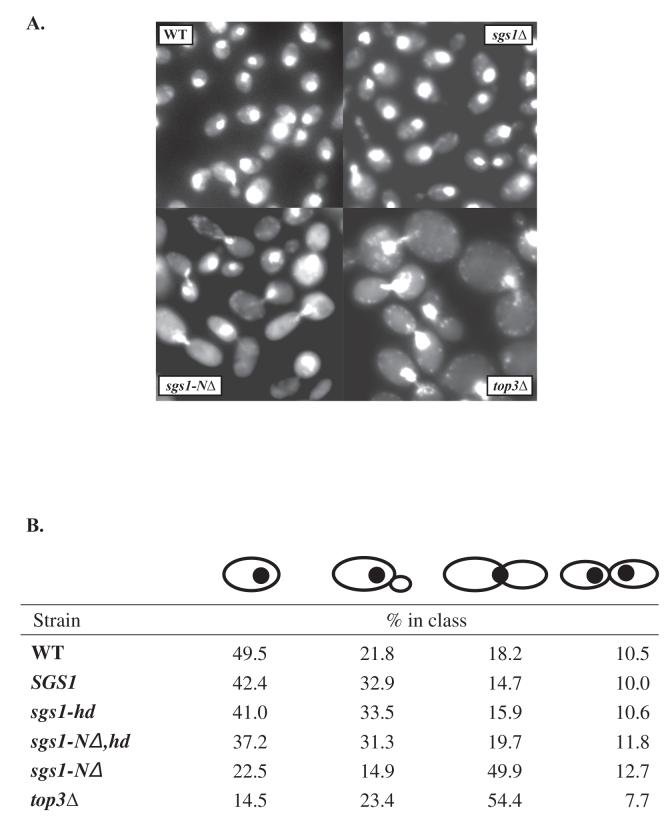
Fig. 3.
(A) Cell cycle distribution of different mutant strains. (A) Mid log-phase cultures of WT, sgs1Δ, sgs1-NΔ and top3 mutant strains were fixed in EtOH and stained with DAPI for visualization of DNA and photographed. (B) For the four strains shown in (A) as well as for sgs1-NΔ and sgs1-hd, at least 500 cells of each genotype were observed and classed according to morphology as shown. These classes correspond roughly to cell cycle phases G1, S, G2/M, M/G1. The percentages of each class are indicated.

