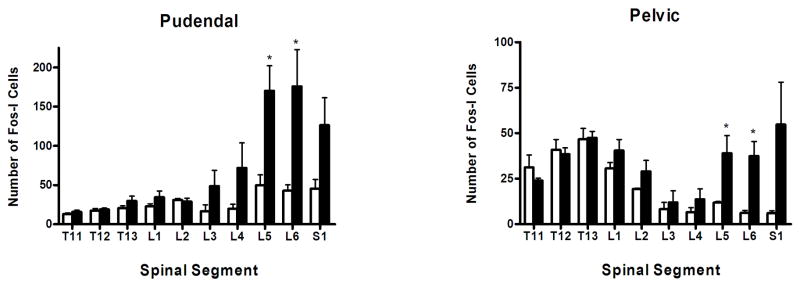
Figure 2.
Histograms showing the total number of fos-I nuclei in each spinal segment of surgical control and pudendal or pelvic nerve stimulated groups. Data represent mean ± SE (n = 4). Open bar - control group; filled bars – stimulated group. * represents a significant difference p< 0.05 from the surgical control group.

