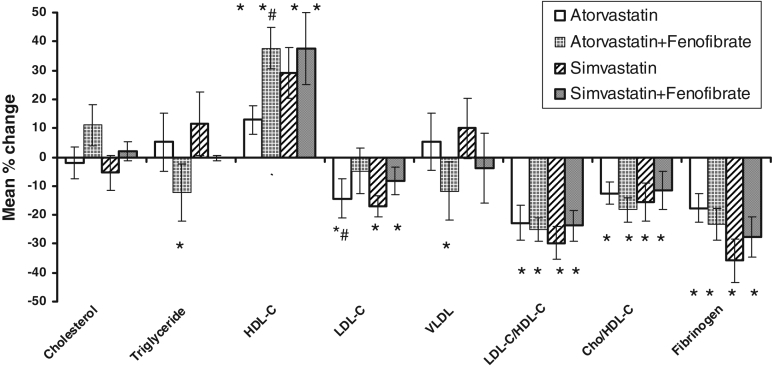
Figure 1.
Mean percentage change in lipid levels among treatment groups. *Significant change from baseline values, Student’s t test, P<0.05; #Significant change compared with the respective statin monotherapy or combination, unpaired Student’s t test, P<0.05; ANOVA applied on percentage change in levels, P>0.05. Changes are not significantly different from each other among groups. Cho Cholesterol; HDL-C High-density lipoprotein cholesterol; LDL-C Low-density lipoprotein cholesterol; VLDL Very low-density lipoprotein cholesterol

