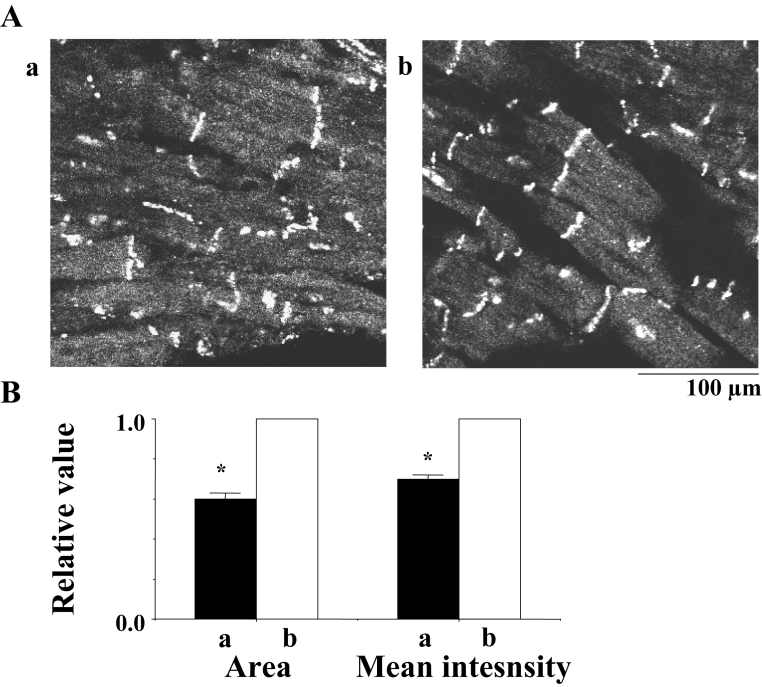
Figure 12.
A Confocal laser scan micrographs of the immunofluorescence of connexin 43 in the rat heart. a and b indicate micrographs 10 min after the beginning of flutter in the absence of d-sotalol and 20 min after the beginning of flutter in the presence of d-sotalol (1.0 μmol/L), respectively. B Statistical analysis of the immunofluorescence of connexin 43 – a comparison of the area and the mean intensity of the immunoreactive signals at the gap junction between a and b; the columns represent the relative value (1.0 is the value in the presence of d-sotalol [b]), and the vertical bars represent the mean ± SEM. P<0.001 versus b

