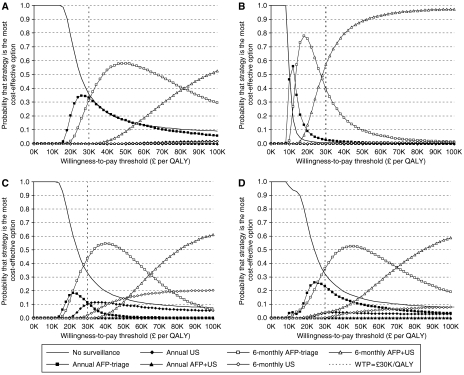
Figure 3.
Cost-effectiveness acceptability curves, showing relative probability of maximal cost-effectiveness among surveillance strategies. (A) ALD-related cirrhosis; (B) HBV-related cirrhosis; (C) HCV-related cirrhosis; (D) mixed aetiology cohort (weighting: 57.6% ALD; 7.3% HBV; 35.1% HCV). Maximal cost-effectiveness reflects the proportion of Monte Carlo simulations (10 000 per aetiology) in which each strategy generated the highest net monetary benefit.

