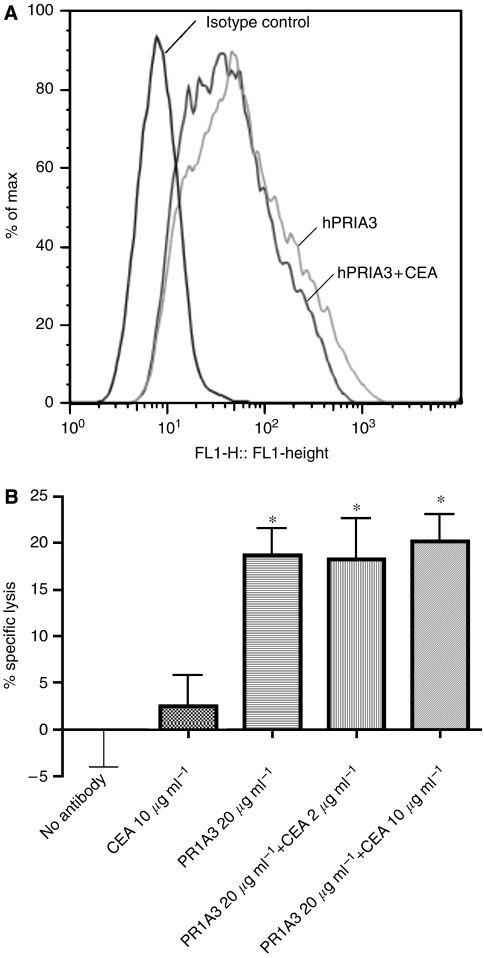
Figure 8.
(A) Indirect staining and FACS analysis to study the effect of addition of soluble CEA on humanised PR1A3 binding to SKCO-1. The left histogram plot is the isotype control. The light grey curve represents the histogram curve for hPR1A3 only (20 μg ml−1) and the dark grey curve represents the curve for hPR1A3 (20 μg ml−1) that has been preincubated with 10 μg ml−1 of soluble CEA. (B) ADCC assay with hPR1A3 on its own, or after preincubation with soluble CEA at final concentrations of 2 and 10 μg ml−1, using purified NK cells (CD56+/CD16+/CD3−) as effectors and fluorescently labelled SKCO-1 cells as targets (effector:target ratio used was 10 : 1). The controls used were no antibody and purified CEA with target and effector cells only. *Indicates P<0.05 compared with the specific lysis of target and effector cells alone.

