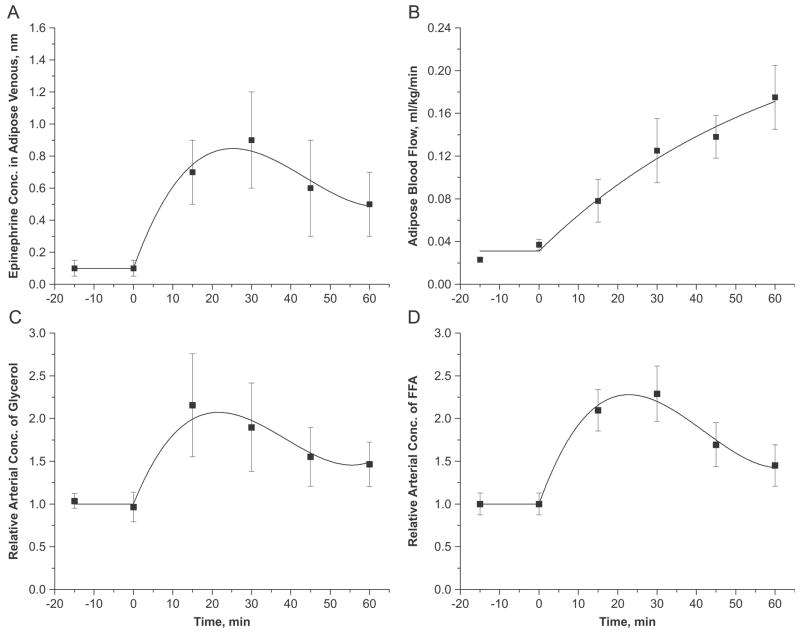
Figure 2.
Dynamic changes in (A) epinephrine concentration in adipose tissue vein, (B) adipose tissue blood flow, and (C, D) relative arterial concentrations of glycerol and FA following the intravenous infusion of epinephrine at time=0. Relative arterial concentration is the ratio of arterial concentrations at any time t>0 to t=0. Squares represent the experimental data (mean±SEM) of Samra et al. (Samra et al., 1996). Solid lines are the model simulations.

