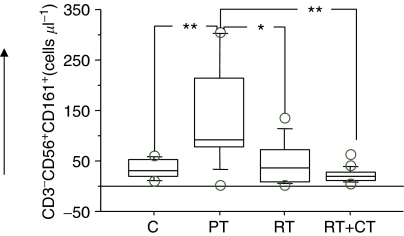
Figure 1.
Absolute number of CD161+NK cells in normal control donors (C) (n=11), pretreatment (PT) (n=9), post-treatment radiation (RT) (n=20) and post-treatment radiation/chemotherapy (RT+CT) (n=21) treated breast cancer patients. The box represents the 25th to 75th percentiles. The line in the middle of the box represents the median. The top whisker is drawn from the value associated with the 75th to the 90th percentile, the bottom one associated with the 25th to the 10th percentile. The outliers show the highest and lowest 10% of observed values. *P< 0.05, **P< 0.01 and ***P< 0.001.

