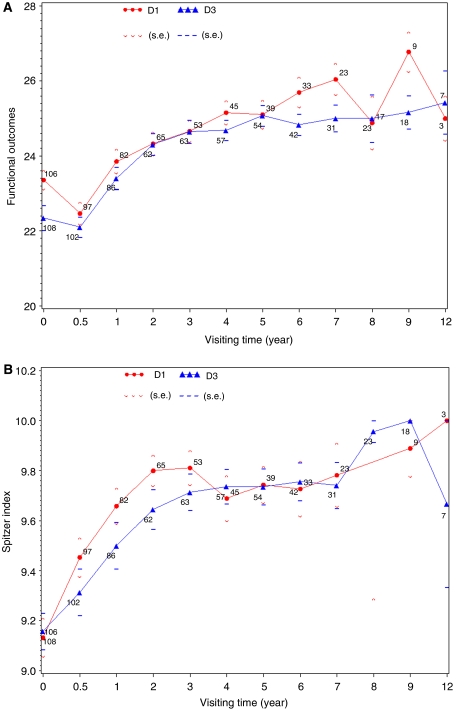
Figure 1.
(A) Average total evaluation score for functional outcome (treatment-specific symptoms), adjusted for time trend and baseline score by treatment arms. Mean scores are presented with s.e. (bars). High scores reflect better quality of life. (B) Average total evaluation score for general health perception (Spitzer Index) adjusted for time trend and baseline score by treatment arms. Mean scores are presented with s.e. (bars). High scores reflect better perception of health status.

