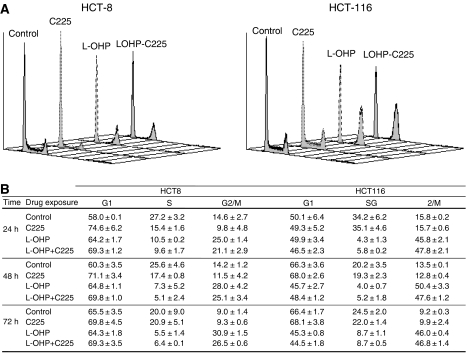
Figure 3.
Effect of cetuximab, oxaliplatin, or combination exposure on cell cycle repartition of HCT-8 and HCT-116 cell lines. The cell cycle distribution of HCT-8 and HCT-116 cells was determined after (A) 24 h exposure to drug-free medium ( ), 20 μg ml−1 cetuximab (C225,
  ), 5 μM oxaliplatin alone (L-OHP,
  ), or a combination of both (
 ). (A representative experiment of three independent assessments is shown), and (B) kinetic evolution until 72 h of the percent of cells in G0/G1, S, and G2/M phases after exposure to either vehicle (control), 20 μg ml−1 cetuximab daily (C225), 5 μM oxaliplatin for 24 h followed by drug-free medium (L-OHP), or the combined treatment of oxaliplatin plus cetuximab for 24 h followed by 20 μg ml−1 cetuximab daily (L-OHP+C225). Results are expressed as the mean±s.e.m. of three independent experiments.

