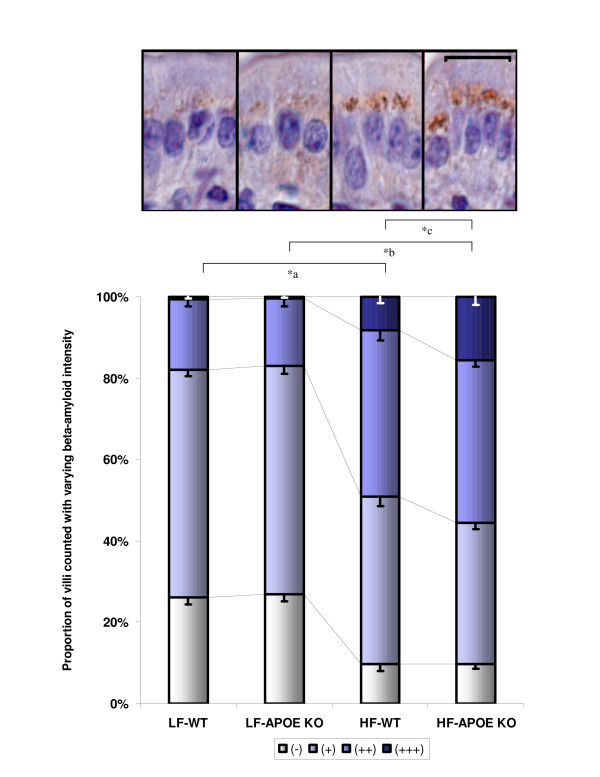
Figure 1.
Enterocytic Aβ in wild-type and apolipoprotein E knockout mice given a high fat diet. Figure shows proportion of small intestinal epithelial cells with different staining intensity for Aβ. Score as follows: (-) no granular coloration, (+) modest with 1–2 granules, (2+) moderate with 3–4 granules or (3+) high, containing larger intense granules. Data was collected for six mice per group, with a minimum of four tissue sections per mouse studied. A minimum of 200 cells per section were scored and statistical significance was determined by one-way ANOVA with post-hoc Bonferroni test. LF-WT and LF-APOE KO mice have significantly (p < 0.05) fewer cells which stained positive for Aβ compared to mice fed high fats (HF-WT and HF-APOE KO *a and *b respectively). Under high-fat feeding, apo E KO mice had significantly greater proportion of cells which expressed Aβ at higher intensity compared to high-fat fed WT mice (*c, p < 0.05). The inset micrograph shows high-magnification of enterocytes from groups corresponding to graphs below. Beta-amyloid colocalized within the perinuclear regions of the cell containing Golgi and ER within enterocytes from all groups. (Scale bar = 20 μm).

