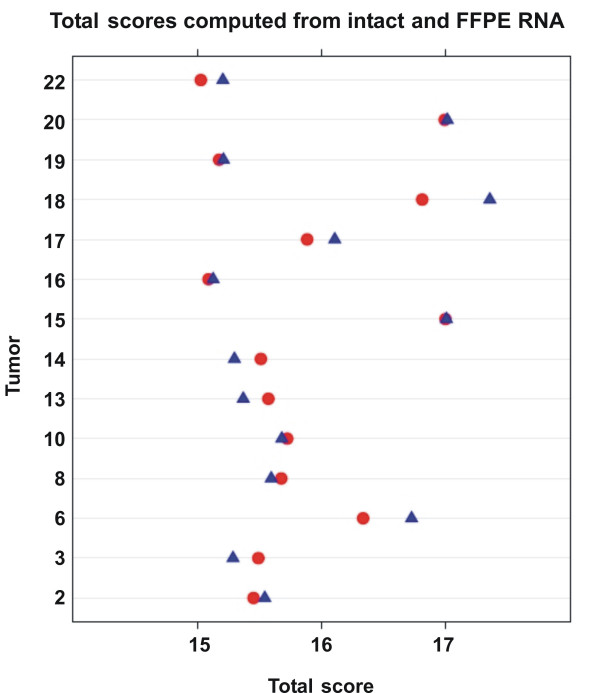
Figure 7.
Comparison of Total scores computed from intact and FFPE-derived RNA. Total scores were computed from normalized expression values based on the results of intact RNA (○) and FFPE-derived RNA (△, own protocol) as described in the Methods section. They are shown separately for each of the 14 tumors.

