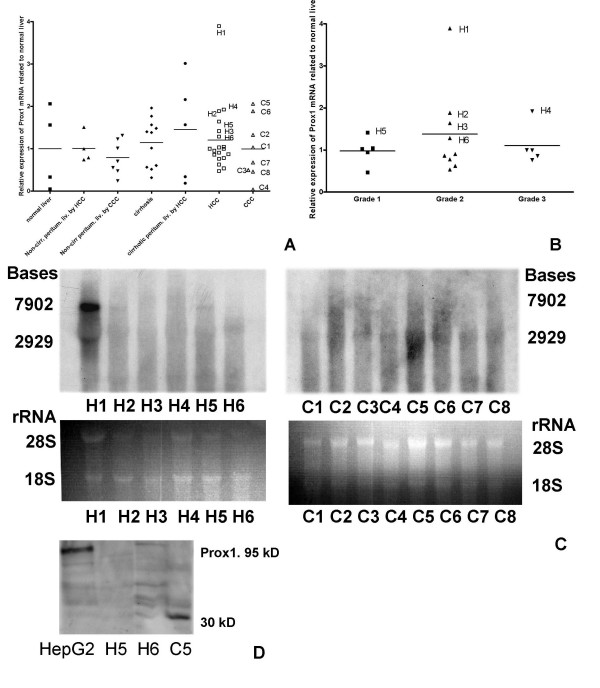
Figure 5.
Quantitative analysis of Prox1 mRNA expression in normal human liver, in peritumoral livers, in liver cirrhosis in HCC and in CCC. (A). Steady-state levels of Prox1 mRNA compared to the average expression of normal liver, which is displayed as 1. (B) Prox1 mRNA expression levels (normalised with the endogenous control) related to the average expression of normal liver compared with grading. (C) Northern blot analysis of Prox1 mRNA expression of individual HCC (left panel) and CCC (right panel) samples (upper images). The gel photos of total RNA are shown as loading references (lower images). The same individual samples are also marked on the graphs of A and B. (D) Western blot analysis of Prox1 protein in nuclear extracts of some individual samples of A-C, nuclear extract of HepG2 was used as a positive control.

