
Figure 6.
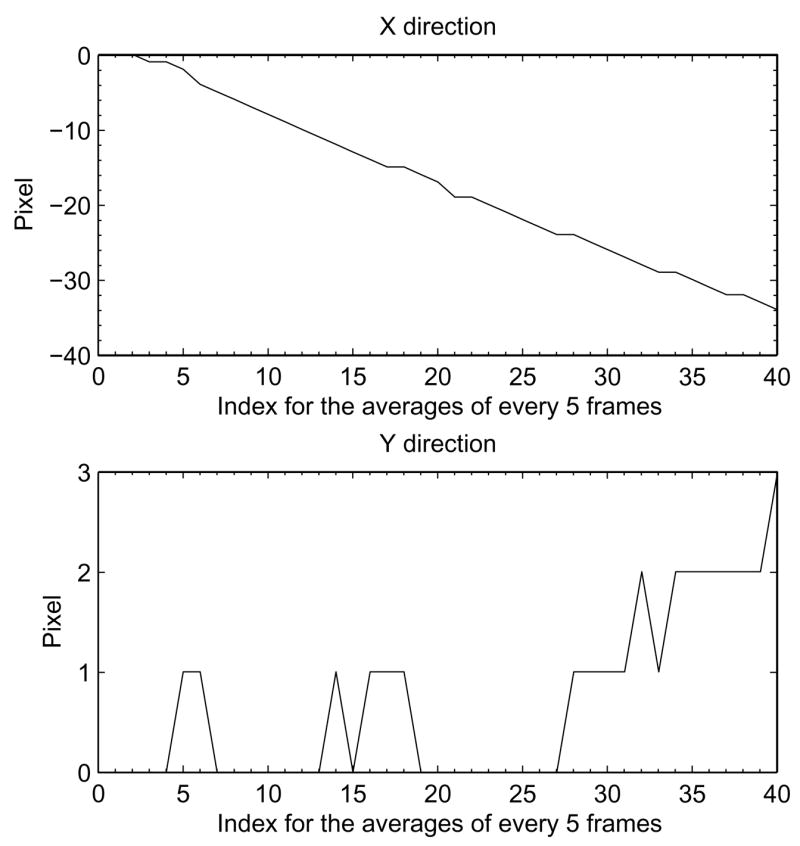
Estimated specimen drift amplitudes in both x- and y- direction of the imaging sensor, calculated using normalized cross correlation applied to the averages of every 5 sequential frames. The x-direction graph shows a substantial drift over time while the y-direction graph shows only slight deviations.