
Figure 7.
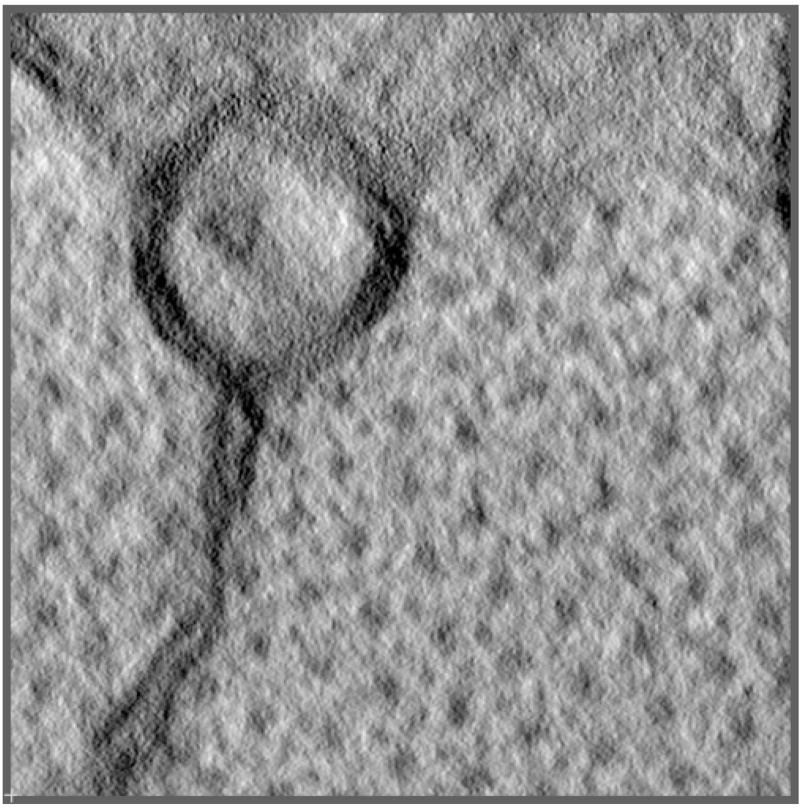
A central x–y slice through the reconstructed cross-sectional cardiac muscle tomographic volume. The total dose at each tile angle is <200 electrons/pixel. The large dots in the lower-right part of the image are the myosin bundles and the actin filaments are represented by the small dots in between the large dots. The linear structure in the lower left part of the image is sarcoplasic reticulum (SR) and it is connected to the mitochondria (at the top of the image) by a circular structure, which cannot be determined due to the limited size of the reconstruction.