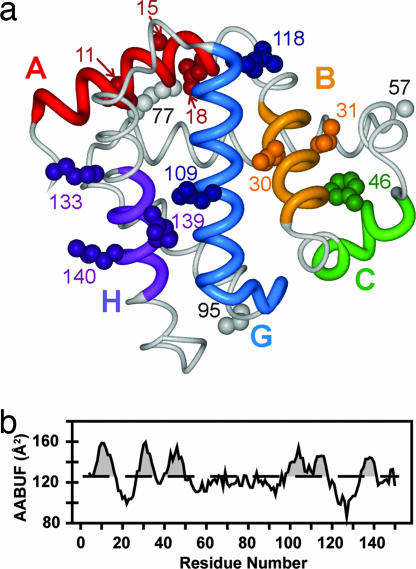
Fig. 1.
Structure and AABUF of myoglobin. (a) Backbone structure of sperm whale holomyoglobin (PDB entry 1MBC) (12). apoMb adopts a similar structure except that the F helix is disordered (29). The side chains of residues that were substituted with spin labels are shown as spheres. Local clusters (interaction sites) are colored red (A region; residues 4–16), orange (B region; residues 27–35), green (C region; residues 40–49), blue (G region; residues 98–117), and purple (H region; residues 134–141). (b) Sequence variation of AABUF, plotted by using a seven-residue moving average. The dashed line is the mean value of AABUF for the entire chain; intersections of the moving average with this value define the local cluster boundaries given above.

