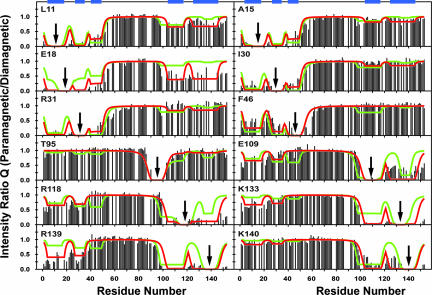
Fig. 3.
Paramagnetic enhancement to nuclear spin relaxation for unfolded apoMb at pH 2.3 in the absence of urea for 12 apoMb variants. Each panel is labeled with the residue for which the spin-labeled cysteine was substituted; arrows indicate the sites of substitution. As in Fig. 2a, the histograms show the experimental intensity ratios. The fitted curves correspond to the initial (green) and corrected (red) models described in the text. The analysis includes previously published data for the E18, K77, and K133 mutants (2). The locations of the local clusters (regions of high AABUF) are indicated by blue bars at the top of the figure. Data for overlapping resonances are omitted from the PRE profiles and analysis (see Table S4 for all measurable Q values under these conditions). Fits for A57 and K77 mutants, the PRE profiles of which exhibit minimal deviations from statistical coil behavior, are included as Fig. S3.

