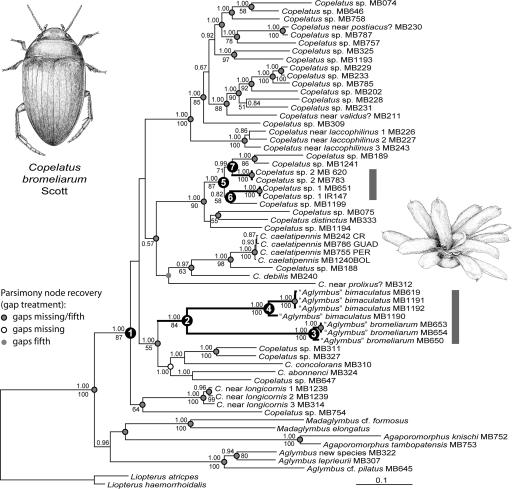
Fig. 1.
Phylogeny of Neotropical Copelatus. The tree is the majority rule consensus of the stationary phase of the Bayesian analysis based on the implied alignment from POY. Values above branches are posterior probabilities (>0.5) as a measure of branch support; numbers below are parsimony bootstrap values above 50% where the same nodes were recovered in either analysis. Bromeliad-associated lineages are marked with thick branches. Nodes labeled 1–7 are discussed in the text.

