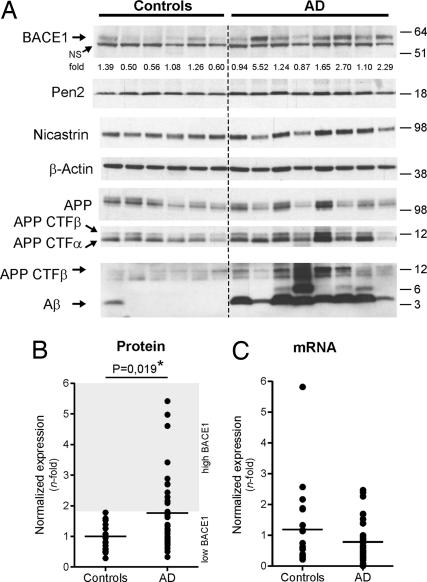
Fig. 2.
BACE1 up-regulation in sporadic AD brain. (A) Representative Western blot of BACE1 (probed with C-terminal antibody), Pen-2 (probed with B96 antibody), Nicastrin (probed with 9C3 antibody), APP full-length (probed with B63 antibody), APP CTFs (probed with B63 and WO2 antibodies), and Aβ (probed with WO2 antibody) in AD and age-matched controls is shown. β-actin was used as normalization control. Densitometric quantifications of BACE1 are shown (fold difference, average of controls = 1). (B) Densitometric quantifications of BACE1 protein levels in sporadic AD (n = 34) vs. controls (n = 21). For each gel, the average of the controls was used as reference (i.e., 1-fold). β-actin was used as normalization control. The graph mean is shown. The “AD high BACE1” subgroup is defined as 2 standard deviations from the controls group. (C) qRT-PCR of BACE1 mRNA from representative controls (n = 20) and from AD patients (n = 34). β-Actin mRNA was used as normalization control. The average of the controls was used as reference (i.e., 1-fold). The graph mean is shown. NS, nonspecific band.

