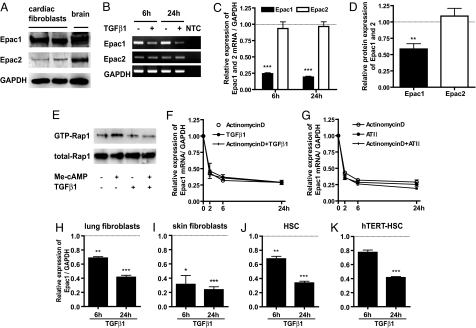
Fig. 1.
Profibrogenic agents attenuate Epac1 expression. (A) Expression of Epac1 and Epac2 protein in rat cardiac fibroblasts (passage 1) grown for 48 h in serum-free media and examined by immunoblot analysis. Freshly isolated rat brain tissue was also blotted. GAPDH was used to calibrate protein loading. (B) Time-dependent changes in the mRNA expression of Epac1, Epac2, and GAPDH in cardiac fibroblasts treated with or without 10 ng/ml TGFβ1. Transcripts from quantitative RT-PCR were analyzed by 2% agarose gel electrophoresis and ethidium bromide staining and were detected as clear bands of the expected length. No template control (NTC) had no amplification. (C) Quantitative RT-PCR standardized to GAPDH was used to examine time-dependent changes in the mRNA expression of Epac1 and Epac2 in cardiac fibroblasts treated with 10 ng/ml TGFβ1 or 100 nM angiotensin II. Data are the fold-increase vs. control for each time-course. n = 4–6; ***, P < 0.001 compared with control for each time-course. (D) Densitometry of the blots for Epac1 and Epac2 protein normalized to GAPDH protein expression. Cardiac fibroblasts were incubated with TGFβ1 (10 ng/ml) for 16–24 h after 48 h serum-starvation. n = 4; **, P < 0.01. (E) Cardiac fibroblasts, serum-starved for 48 h, were incubated with or without TGFβ1 (10 ng/ml) for 24 h and then with Me-cAMP (50 μM) for 15min. Cells were lysed and assayed for Rap1 activation. Precipitates (Top) and total cell lysates (Middle) were analyzed by immunoblotting with an anti-Rap1 antibody. (F and G) Expression of Epac1 mRNA in cardiac fibroblasts treated with actinomycin D (5 μg/ml), TGFβ1 (10 ng/ml) or angiotensin II (ATII, 100 nM), using quantitative RT-PCR standardized to GAPDH. n = 4–6. (H–K) Time-dependent (6 h and 24 h) changes in the mRNA expression of Epac1 standardized to GAPDH in rat lung fibroblasts, rat skin fibroblasts, mouse hepatic stellate cells (HSC), and human hepatic stellate cells (hTERT-HSC) treated with 10 ng/ml TGFβ1. Data are the fold- increase vs. control for each time point. n = 6; *, P < 0.05; **, P < 0.01; ***, P < 0.001 compared with control for each time point.

