Fig. 6.
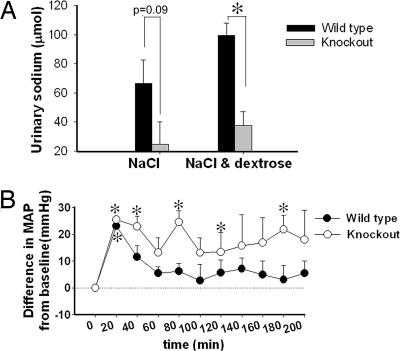
Altered natriuresis in KO mice. (A) Urinary sodium excretion (absolute) in response to gavaged NaCl (0.9%) with and without dextrose in 4 h, μmol per 4 h (n = 6 per genotype). *, a significant (P < 0.05) difference between the groups. (B) ΔMAP in response to gavaged NaCl plus dextrose in mice (n = 4 per genotype). *, a significant elevation (P < 0.05) from baseline.

