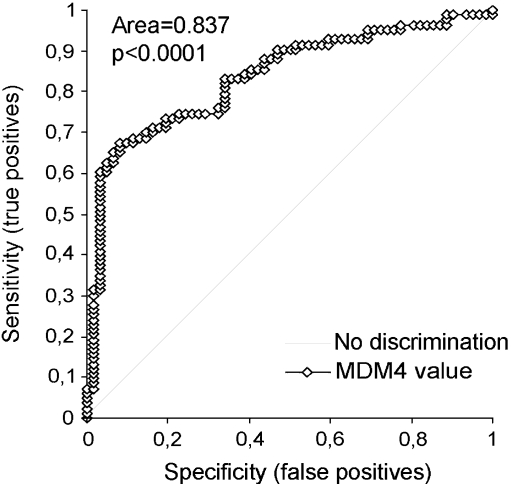
Fig. 2.
Receive operator characteristics curves for MDM4 levels between normal and tumor samples, assessing variable MDM4 levels as diagnostic test. The plot shows sensitivity of the test against specificity. p value was 0.0001. For each decision threshold, the percentage of tumor cases correctly identified as such (true positives) against the percentage of normal cases incorrectly diagnosed as tumor (false positives) is shown

