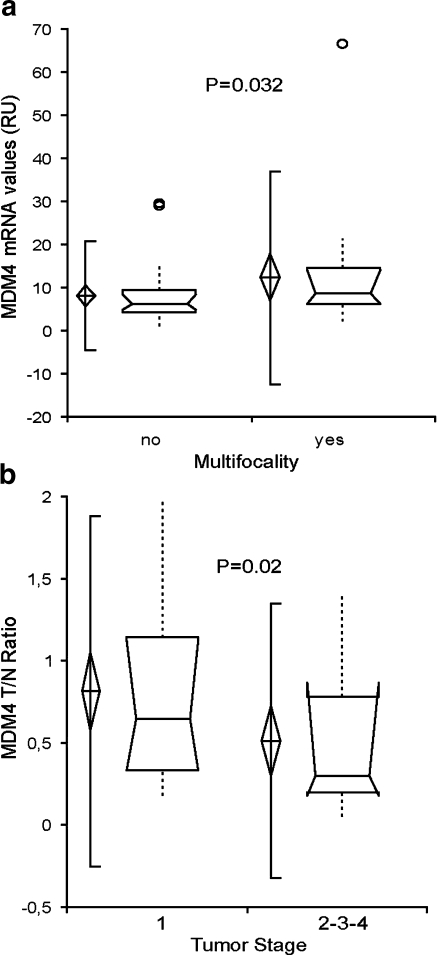
Fig. 5.
a Vertical box-whisker plots showing MDM4 levels between nonmultifocal (no) and multifocal (yes) tumors. Each plot shows graphically the central location and scatter–dispersion of the values of each group: the line series shows parametric statistics (mean and confidence interval of mean) while the notched box and whiskers show nonparametric statistics (median, confidence interval of median, and interquartile range). Crosses and circles indicate possible outliers, between 1.5 and 3 interquartile range and over 3 interquartile range, respectively. p value was calculated according to Spearman test. b Vertical box-whisker plots showing tumor–CTRL MDM4 mRNA levels in stage 1 compared to other stages of tumors. Each plot shows graphically the central location and scatter–dispersion of the values of each group: the line series shows parametric statistics (mean and confidence interval of mean) while the notched box and whiskers show nonparametric statistics (median, confidence interval of median, and interquartile range). Crosses and circles indicate possible outliers, between 1.5 and 3 interquartile range and over 3 interquartile range, respectively. p value was calculated according to Spearman test

