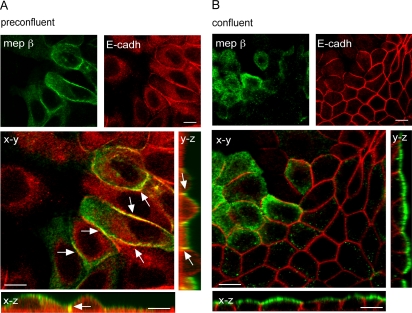
Figure 3. Meprinβ is partially colocalized with E-cadherin in MDCKαβ cells.
The distribution of meprinβ and E-cadherin was analyzed by double immunostaining and CLSM in preconfluent (A) and confluent (B) monolayers. Pictures shown are single optical sections in the x–y axis. Corresponding orthogonal sections in the x–z and y–z axis are shown beside. Arrows in the merged picture indicate were meprinβ and E-cadherin colocalize (evidenced by the yellow color). Bar = 10 µm.

