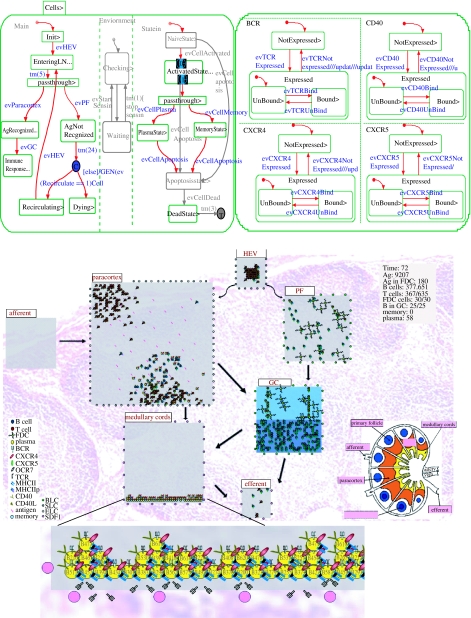
Figure 4.
From a model of the lymph node [SCH06]. Snapshots of a Statechart simulation in Rhapsody, carried out under standard conditions, together with the animated outcomes presented in Flash. The left-hand statechart describes part of the behaviour of a B cell, which undergoes many changes as the organ evolves; the right-hand statechart describes four of the many cell receptors that play an important role in the immune response. Below the statecharts is a snapshot of the resulting animation in Flash showing the various elements in the various parts of the lymph node; see [SCH06].

