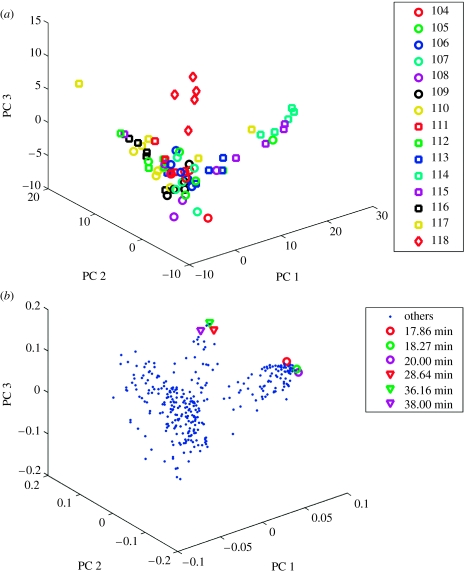
Figure 2.
(a) Scores and (b) loadings plots showing markers that distinguish individuals. This is an example of one family with individuals numbered and coded with coloured symbols in the scores plots. Key peaks are indicated and their retention times listed in the loadings plot. The scores and loadings for principal component analysis on these data are presented: scores provide information about samples (or subjects), whereas loadings provide complementary information about the compounds that characterize these samples.

