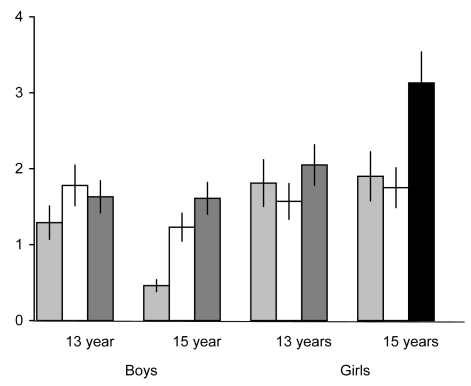
Figure 1.
A ratio between perceptions of being “too fat” among adolescents with body mass index (BMI) ≥85th percentile and perception of being “too thin” among adolescents with BMI ≤15th percentile. Open bars – Croatia; gray bars – Lithuania; closed bars – United States; vertical lines – 95% confidence interval.

