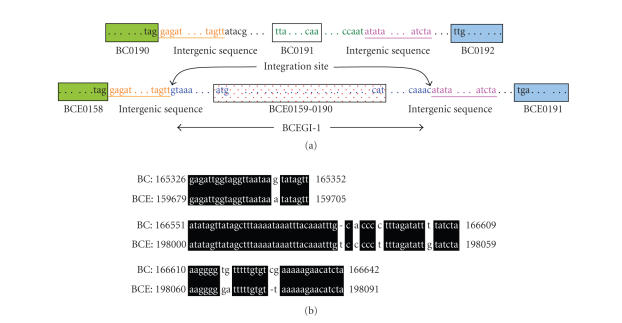
Figure 4.
Determination of the integration sites of BCEGI-1 based on comparative analysis between B. cereus ATCC 10987 and B. cereus ATCC 14579. Besides gene orders, the intergenic sequences of the two genomes are also highly conserved. Therefore, the sequence segments that are absent in the genome of B. cereus ATCC 14579 are likely horizontally transferred. (a) Schematic diagram of BCEGI-1. The same color denotes homologous regions. The first or last codons of ORF's are marked. Integration sites are indicated. The figure is not drawn to scale. (b) Alignment of homologous intergenic sequences between the two genomes. BC denotes B. cereus ATCC 14579, whereas BCE denotes B. cereus ATCC 10987.

