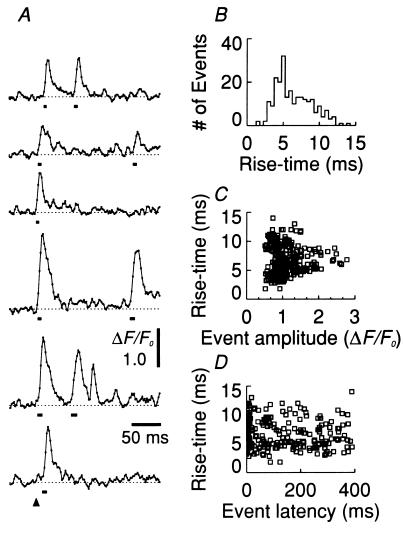
Figure 2.
Characterization of individual Ca2+ sparks activated by a large depolarization after brief repriming of the fiber of Fig. 1. (A) Time course of ΔF/F0 from the six triad locations marked by arrowheads of Fig. 1D. Note the expanded time scale in A compared with Fig. 1 and linear interpolation between values at 2-ms intervals. Solid bar under each spark represents the 10–90% rise time of the event. Arrowhead (bottom) indicates the start of the test depolarization, which continues for the duration of the record. (B) Histogram of rise times of all identified events in Fig. 1 A–C and one other image at the same scan location and pulse protocol. (C and D) Rise time of each identified event in A plotted as a function of its amplitude (C) or its latency after the start of the depolarization (D).

