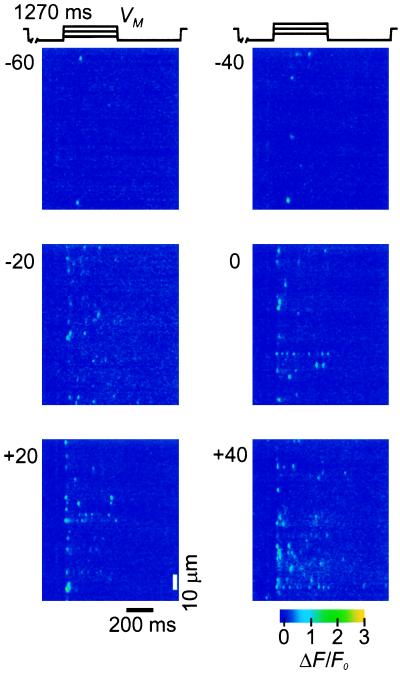
Figure 4.
Confocal line-scan images of ΔF/F0 showing Ca2+ sparks activated by depolarizations to various voltages from −60 to +40 mV. Each image represents a 400 ms test pulse to the indicated membrane potential, VM, applied after constant brief repriming (1,270 ms at −90 mV) of a depolarized fiber.

