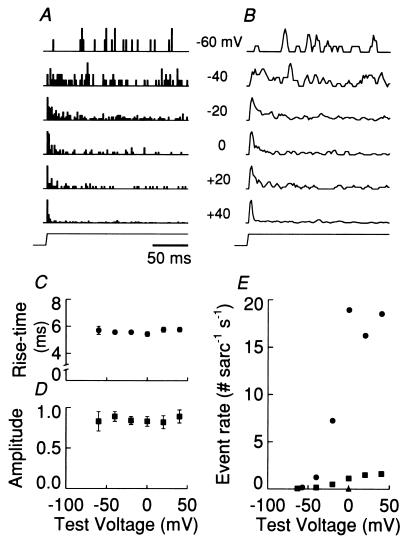
Figure 5.
Voltage dependence of event patterns and rates. Ca2+ sparks were identified in the images of Fig. 4 and several other images (not shown) for test pulses to various membrane potentials, each applied after the same brief repriming pulse. (A and B) All-latency histograms (A) and rate of release waveforms (B) at each test voltage as indicated. Each histogram (A) or record (B) was normalized to the maximum value. (C and D) Voltage dependence of spark rise time (C) and spark amplitude in units of ΔF/F0 (D). Each point is the mean ± SEM of 33–249 events identified at each voltage. The slopes of a straight-line fit to the points in C and D were not significantly different from zero (not shown). (E) Voltage dependence of event rate during the first 20 ms (•) and the last 350 ms (▪). ▴ represents the rate of spontaneous events at the holding potential of 0 mV. Multiple runs for each test pulse made over 45 min, bracketed by pulses to +40 mV, necessitated a correction for the run down of the absolute event rate (≈3-fold change). However, the ratio of the number of events occurring during the first 20 ms to the number during the last 350 ms was constant over the time of the experiment.

