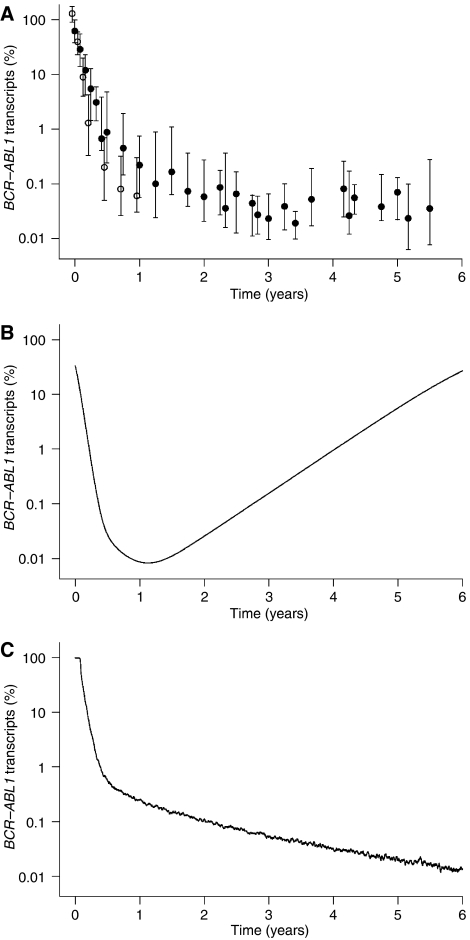
Figure 1.
BCR-ABL1 transcript dynamics for CML under imatinib treatment: (A) Datapoints represent median and interquartile range of BCR-ABL1 transcript levels in peripheral blood, determined in two independent study populations: BCR-ABL1/BCR percentages of 68 individuals with imatinib-treated CML over 1 year, previously published by Michor et al (2005) (open circles) and BCR-ABL1/ABL1 percentages of 69 individuals with imatinib-treated CML from the German cohort of the IRIS trial over 5.5 years, previously published by Roeder et al (2006) (filled circles). (B) Long-term simulation results of BCR-ABL1 levels according to the model discussed by Abbott and Michor (2006). Parameters are taken from the original publication of this model (Michor et al, 2005). (C) Long-term simulation results of BCR-ABL1 levels according to the model introduced by Roeder et al (2006). Parameters are taken from the given reference.

