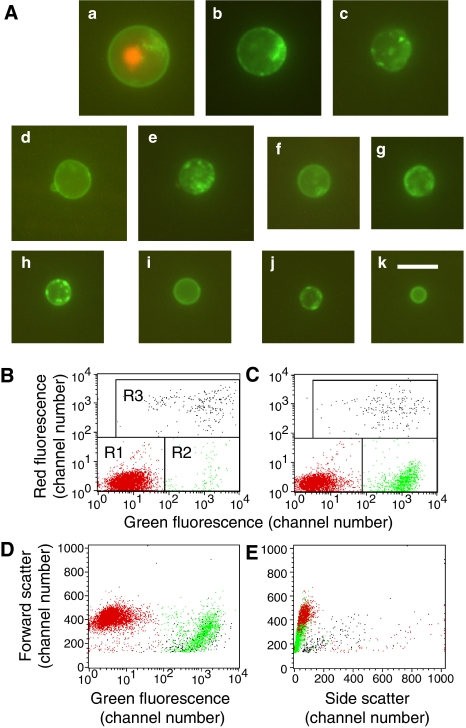
Figure 3.
Annexin V-positive, propidium iodide (PI)- negative cells, and subcellular fragments after 4 h treatment of Jurkat cells with 4 μM camptothecin. (A) Representative photographs showing ‘apoptotic cells’ of varying sizes and a lysed cell (a) stained with both annexin V and PI for comparison. The ‘apoptotic cells’ range in size from 12.2 μM (b) to 3.8 μM (k). The diameter of normal Jurkat cells is 11.0±1.0 μM, so slightly smaller than the cell shown in (b). Bar=10.0 μM. FACS dot plots show control cells (B) or CTT-treated cells (C) stained with annexin V (green) and propidium iodide (red). The marked regions R1, R2, and R3 include healthy, apoptotic, and lysed cells, respectively, and apoptotic cells are coloured green, normal cells red, and lysed cells black. (D) The same cells as in (C), with the same colouring, are shown in a plot of forward scatter vs. green fluorescence. Note that the ‘apoptotic cells’ (green) are smaller then normal cells (red), and of varying size, so there is no obvious separation between apoptotic cells and subcellular fragments. (E) Similar to (D), but a plot of forward scatter vs side scatter, further showing the overlap between normal cells, apoptotic cells, and subcellular fragments.

