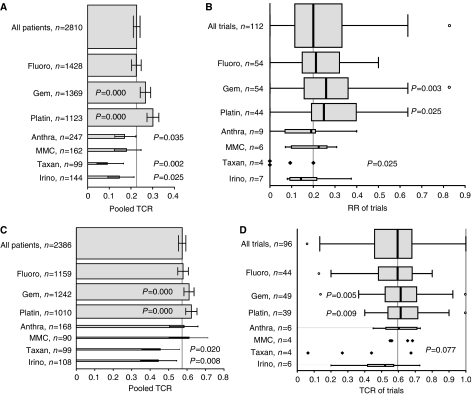
Figure 4.
(A–D) Fluoro: fluoropyrimidines (fluorouracil, capecitabine, tegafur); Gem: gemcitabine; Platin: platinum compounds (cisplatin, oxaliplatin, carboplatin); Anthra: anthracyclines (adriamycin, epirubicin); MMC: mitomycin C; Taxan: taxanes (paclitaxel, docetaxel), Irino: irinotecan. (A) Pooled RRs (RR=CR+PR) and 95% CIs of all patients included in the analysis and of subgroups of patients, defined by treatment with regimens containing a particular drug regardless of other drugs. The height of the bars correlates with the number of patients. The P-values apply to the comparison of a subgroup, defined by a particular drug vs all other patients, which were not treated with this drug (e.g., patients treated with gemcitabine or gemcitabine-containing combinations vs patients treated with gemcitabine-free regimens). The RRs of the comparison subgroups are not shown. The vertical grey line represents the pooled RR of all patients (pts, 22.6%). (B) Boxplots of the RRs of all trials and of subgroups, defined by a particular drug. The height of the boxplots correlates with the number of trials. P-values for subgroup comparison as in Figure 3A. The vertical grey line represents the median RR of all trials (20.0%). For subgroups consisting of less than five trials, results of single trial are shown and no boxplots are provided. (C) Pooled TCRs (TCR=CR+PR+SD) and 95% CIs as in Figure 3A. The vertical grey line represents the pooled TCR of all patients (57.3%). (D) Boxplots of the TCRs as in Figure 3B. The vertical grey line represents the median TCR of all trials (59.6%).

