Figure 5.
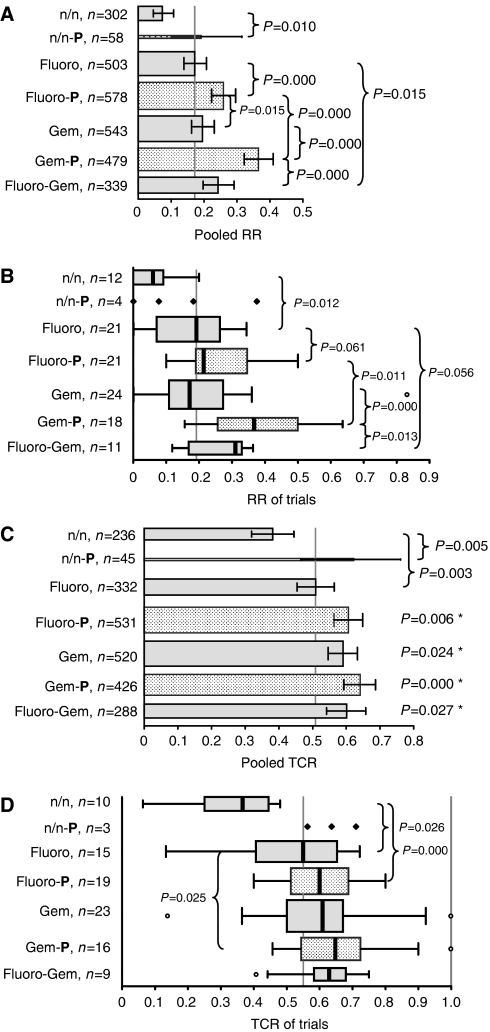
(A–D) Fluoro: n/n: neither Fluoro nor Gem; Fluoro: fluoropyrimidines (fluorouracil, capecitabine, tegafur); Gem: gemcitabine; P: platinum compounds (cisplatin, oxaliplatin, carboplatin). (A) Pooled RRs (RR=CR+PR) and 95% CIs of subgroups of patients, defined by treatment with fluoropyrimidines, gemcitabine, and platinum compounds, regardless of other drugs. The height of the bars correlates with the number of patients. The vertical grey line represents the pooled RR of the Fluoro subgroup (17.1%). The Fluoro-Gem-P subgroup consists of only eight patients and is therefore not shown. Additional P-values: Fluoro vs Gem-P: 0.000; n/n vs all other subgroups: 0.000; n/n-P vs Gem-P: 0.012. (B) Boxplots of RRs of subgroups of trials, defined by treatment with fluoropyrimidines, gemcitabine, and platinum compounds. The height of he boxplots correlates with the number of trials. The vertical grey line represents the median RR of the Fluoro subgroup (19.2%). The Fluoro-Gem-P subgroup consists of only one trial and is therefore not shown. For subgroups consisting of less than five trials, results of single trial are shown and no boxplots are provided. Additional P-values: Fluoro vs Gem-P: 0.000; Fluoro-P vs Gem: 0.033; n/n vs all other subgroups: ⩽0.002; n/n-P vs Gem-P: 0.042. (C) Pooled TCRs (TCR=CR+PR+SD) and 95% CIs of subgroups of patients as in Figure 4A. The vertical grey line represents the pooled TCR of the Fluoro subgroup (50.9%). *P-value in comparison to the Fluoro subgroup. Additional P-values: n/n vs all other subgroups: 0.000. (D) Boxplots of TCRs of subgroups of trials as in Figure 4C. The vertical grey line represents the median RR of the Fluoro subgroup (55.0%). Additional P-values: n/n vs all other subgroups: ⩽0.003.

