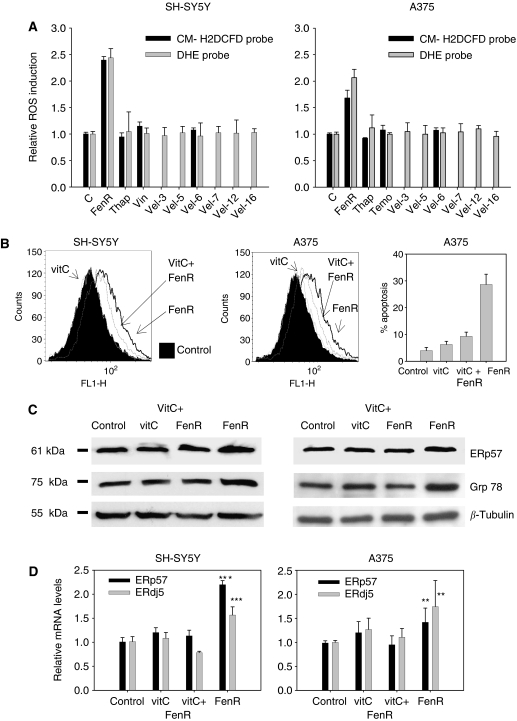
Figure 4.
Blocking ROS with an antioxidant inhibits fenretinide-induced stress responses in SH-SY5Y and A375 cells. In all experiments, fenretinide was used at 3 μM to treat SH-SY5Y cells and at 10 μM to treat A375 cells; vitamin C (100 μM) was added to cells 2 h before adding fenretinide and incubation continued in the presence of both reagents for a further 22 h. (A) A comparison of ROS induction in response to fenretinide (FenR), thapsigargin (Thap), vincristine (Vin; SH-SY5Y cells), temozolomide (Temo; A375 cells) or velcade (Vel)in SH-SY5Y cells (left panel) and A375 cells (right panel). ROS levels are expressed relative to control vehicle treatment and were measured with two different probes for reactive oxygen intermediates: CM-H2DCFDA or DHE in separate experiments. Bar heights are means plus upper 95% confidence interval of CM- H2DCFDA fluorescence (black bars) or DHE fluorescence (grey bars) (n=3, but n=6 for control and fenretinide-treated cells). ROS was measured after 6 h for control, fenretinide, thapsigargin, vincristine or temozolomide treatments, but for velcade after 3, 5, 7, 12 and 16 h using the DHE probe and 6 h with CM-H2DCFDA or DHE probes. (B) left and centre panels: flow cytometry CM- H2DCFDA-fluorescence profiles for SH-SY5Y (included as a positive control) or A375 cells showing the induction of ROS by fenretinide (FenR) and the reduction in fenretinide-induced ROS in cells after pretreatment with 100 μM vitamin C 2 h before adding fenretinide (VitC+FenR). Vitamin C alone (VitC) did not increase ROS above the background control. Ordinate, event counts; abscissa, fluorescence signal intensity (FL1-H). Right panel: abrogation of fenretinide-induced apoptosis in A375 cells by vitamin C (mean and upper 95% confidence interval of three replicates). (C) Western blots showing that the fenretinide-induced increase in expression of ERp57 and GRP78 protein in response to fenretinide was inhibited by pretreatment of SH-SY5Y or A375 cells with vitamin C. (D) The fenretinide-induced increase in ERp57 and ERdj5 mRNA in SH-SY5Y and A375 cells, as measured by real-time quantitative PCR, was inhibited by pretreatment with vitamin C. Bar heights are means plus 95% confidence limit for triplicates samples. Contrasts were used within one-way ANOVA to compare relative ERp57 or ERdj5 mRNA levels in cells treated with fenretinide or fenretinide plus vitamin C; **P<0.01, ***P<0.001. For ERp57 or ERdj5 in SH-SY5Y cells, one-way ANOVA F3,8>39, P<0.0001, contrasts: fenretinide versus fenretinide plus vitamin C F1,8>112, P<0.0001. For ERp57 or ERdj5 in A375 cells, one-way ANOVA F3,12>6, P⩽0.007, contrasts: fenretinide versus fenretinide plus vitamin C F1,12>13, P=0.003. In A-D, control, vehicle control; vitC, cells treated with 100 μM alone; FenR, SH-SY5Y or A375 cells treated with 3 μM or 15 μM fenretinide, respectively; vitC+FenR, cells pretreated with 100 μM vitamin C 2 h before adding fenretinide.

