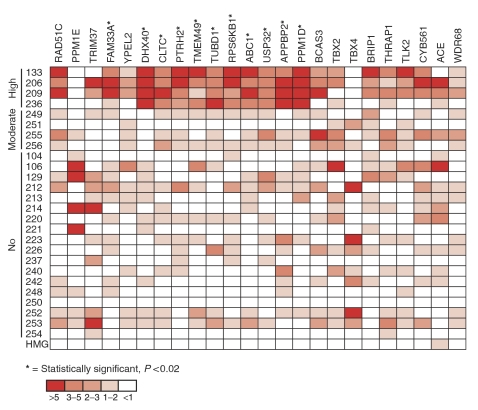
Figure 2.
Schematic representation of expression levels of 24 known genes within the 17q23 chromosomal region in 26 primary breast tumours and normal HMG. Primary tumours are arranged according to their 17q23 amplification status and genes are organised based on their physical order at the 17q23 region from centromere to telomere. Expression levels were determined using qRT-PCR and were normalised against a housekeeping gene TBP. The relative expression values of each gene were median-corrected and displayed using a colour code (shown at the bottom).

