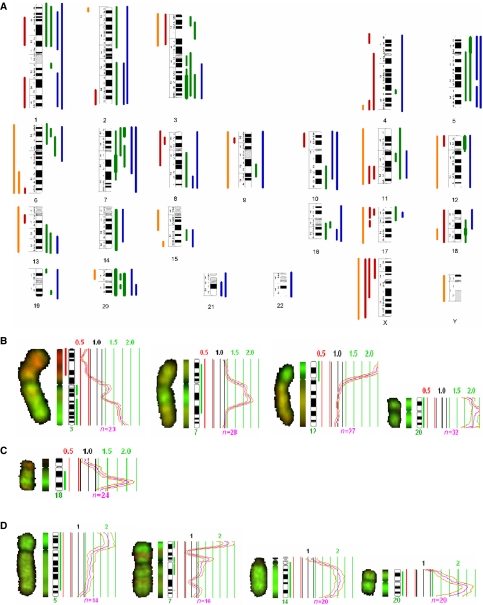
Figure 2.
(A) Summary of the DNA copy number changes detected by CGH. Each bar in the left side of the chromosome ideograms represents a loss in one cell line (red—ATC, orange—PDTC) and each bar on the right side of represents a gain in one cell line (green—ATC, blue—PDTC). High-level amplifications are represented by thicker lines. (B) T235 HLA regions at 3q24-qter, 7q11.2-q22, 12pter-p11, and 20pter-qter; (C) T238 HLA at 18q21; (D) T241 HLA regions at 5pter-p12, 14q10-qter and 20p11.1-qter.

