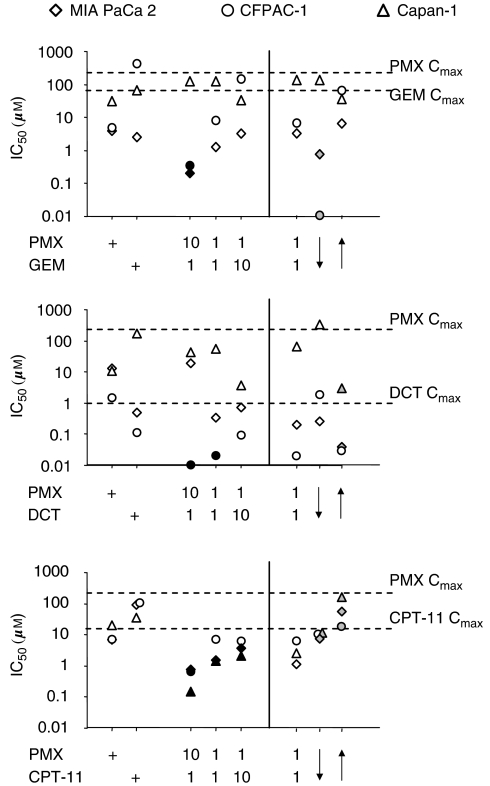
Figure 2.
The IC50s (μM) of PMX–GEM, PMX–DCT and PMX–CPT-11 combinations. The 10 : 1, 1 : 1 and 1 : 10 concentration ratio of PMX/GEM, PMX/DCT and PMX/CPT-11 combinations were represented. Moreover, MIA PaCa2, CFPAC-1 and Capan-1 pancreatic cancer cell lines were treated with (a) PMX together with GEM, DCT or CPT-11 (0.001–100 μM, ratio 1 : 1) for 48 h; (b) PMX (0.001–100 μM) for 24 h followed by GEM, DCT or CPT-11 for 24 h (ratio1 : 1); (c) the reverse sequence of point (b). The IC50 values of the different ratio and sequences were calculated and reported. All the values are expressed as medians of six experiments. Black colour-filled symbol=IC50 significantly less than the IC50s of the single drug (P<0.05, Wilcoxon Signed Ranks test). Grey colour-filled symbol=IC50 significantly less than the IC50 of the simultaneous exposure for 48 h (P<0.05, Wilcoxon Signed Ranks test). Dotted lines: Cmax of GEM, DCT, CPT-11 and PMX.

