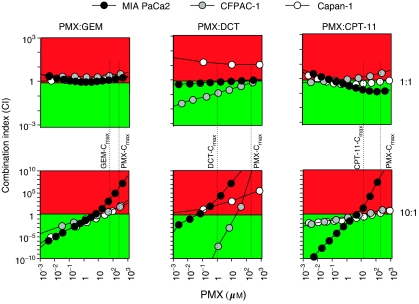
Figure 3.
Combination index (CI) plots of PMX/GEM, PMX/DCT and PMX/CPT-11 association in MIA PaCa2, CFPAC-1 and Capan-1 pancreatic cancer cell lines. Data are represented as concentration/combination index (CI) plot. The CI was calculated in a constant ratio combination experimental design. The 1 : 1 and 10 : 1 concentration ratio of PMX/GEM, PMX/DCT and PMX/CPT-11 combinations were represented. CI<1 (green colour), CI=1 and CI>1(red colour) indicate synergistic, additive and antagonistic effects, respectively. Dotted lines: Cmax of GEM, DCT, CPT-11 and PMX. The plots represent the mean of six experiments.

