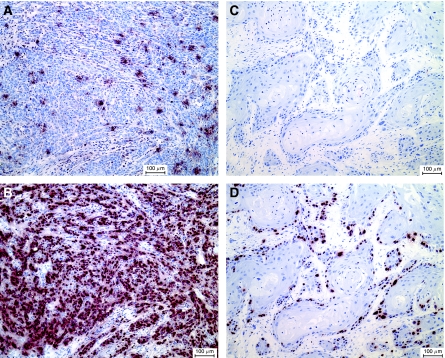
Figure 3.
(A and B) In situ TUNEL for apoptotic cells (A) and MIB-1 staining for proliferating cells (B) in an OSCC with Pidd overexpression compared to normal oral epithelium (Pidd expression=4.09 relative units, AI=1.31%, PI=42%). (C and D) In situ TUNEL for apoptotic cells (C) and MIB-1 staining for proliferating cells (D) in an OSCC with Pidd underexpression compared to normal oral epithelium (Pidd expression=0.36 relative units, AI=0.03%, PI=19%). Apoptotic cells (A and C) and MIB-1 expressing cells (B and D) are stained brownish-red and the sections are counterstained with haematoxylin. Bar indicates 100 μm.

