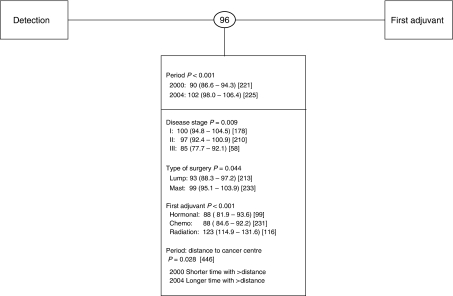
Figure 3.
Wait times at low resolution. Shown in circles between intervals, are unadjusted geometric mean number of elapsed days. Below each interval are shown the covariates found to have a significant effect. Adjusted geometric mean number of days with 95% confidence intervals are shown in parenthesis and the sample size appears in square brackets. Period main effects are shown for every interval and interaction terms are represented by a colon. Period 2000 refers to cohort 1; Period 2004 refers to cohort 2.

