Figure 1.
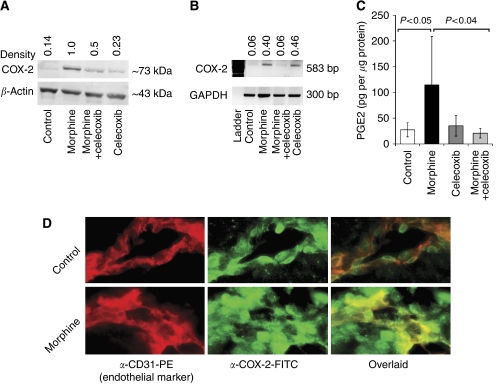
Cyclooxygenase-2 expression and PGE2 concentration in breast tumours of mice after 13 days of treatment (or 14 days after tumour cell injection) with morphine and co-administration with celecoxib. (A) Western blot showing upregulation of COX-2 protein in the region of 72–74 kDa, whereas β-actin is shown as a loading control. The arbitrary densitometric units above the bands show the ratio of COX-2 to β-actin. (B) RT-PCR, showing an upregulation in COX-2 gene expression in the expected region of 583 bp. Bands on the bottom show the equal loading of RNA represented by GAPDH. Arbitrary numeric units show the ratio of COX-2 to GAPDH expression. (C) Prostaglandin E2 concentration is significantly increased in tumours of mice treated with morphine. Data are shown as mean±s.d. n=3–5 experiments per observation/data shown. (D) Immunofluorescent staining of tumour cryosections using anti-CD31 PE (red), an endothelial cell marker and anti-COX-2 followed by a 2° Ab conjugated with FITC (green). The overlaid image in the right hand panel shows yellow staining due to increased COX-2 in the endothelium in morphine-treated mice. Larger number of non-endothelial cells show COX-2 expression (green) in middle and overlaid panel after morphine treatment. Magnification, × 600.

