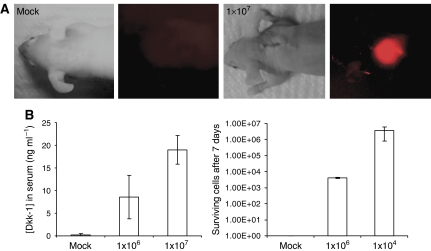
Figure 4.
(A) Live animal fluorescence imaging of an implanted construct containing labelled MG63 OS cells. (B) Evaluation of human Dkk-1 levels in the blood of implanted animals after 1 week. The x-axis represents the initial number of implanted cells. Measurements were achieved by ELISA on mouse serum, values represent the mean (n=4, two men and two women), and error bars represent s.d. P-values were calculated by two-tailed Student's t-test.

