Figure 1.
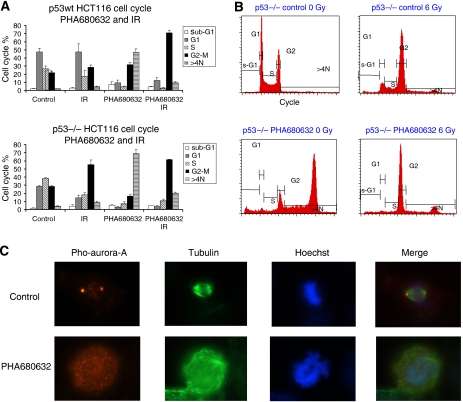
Influence of PHA680632 on cell cycle in p53wt vs p53−/− HCT116 cells. (A and B) analysis of the cell cycle. (A) Quantitative data of cell cycle distribution after PHA680632 and 6 Gy of irradiation in p53wt HCT116 (above) and p53−/− HCT116 (below) have been shown in the two histograms. The mean values (percentage of sub-population of different cell cycle: sub-G1, G1, S, G2–M, and >4N cells is shown in different conditions: control, IR, PHA680632, or PHA680632+IR combination) of three independent experiments are shown and bar errors represent s.e.m. Twenty-four hours exposure to 400 nM PHA680632 led to the apparition of >4N DNA content cells in the two HCT116 cell lines (P=0.0081 and P=0.0005 for p53wt and p53−/− HCT116, respectively), PHA680632 induced a greater accumulation of cells with >4N DNA content in p53−/− HCT116 cell line when compared to their p53 wild counterparts (P=0.0482); a moderate G2–M block was observed 24 h after 6 Gy irradiation in the control cells. At 24 h after 6 Gy irradiation and PHA680632, exposure dramatically reduced the percentage of cells with >4N DNA content cells compared with PHA680632 alone (P=0.0068 and P=0.0119 for p53wt and p53−/− HCT116, respectively). (B) A representative cell cycle analysis in p53−/− HCT116 cells. (C) Immunofluorescence images showing phospho-T288-Aurora-A (Pho-Aurora-A) in mitotic p53wt HCT116 cells after 24 h exposure of 1 μM PHA680632 (below) or control (above). β-Tubulin and Hoechst were used to visualise microtubule and DNA, respectively.

