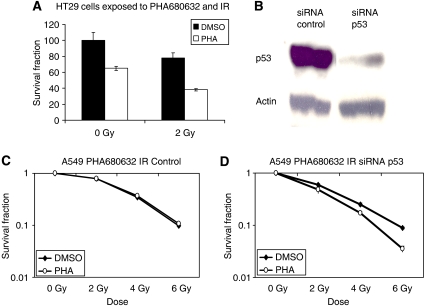
Figure 4.
Influence of p53 inhibition by siRNA on the response to PHA680632-IR combination in A549 and HT29 cells. (A) Histogram showing the percentage of plating efficiency in HT29 cells treated with 1 μM PHA680632 or DMSO for 24 h; cells were then irradiated to 6 Gy or sham irradiated; error bars represent s.d. The P-value was <0.0001 for PHA680632 alone vs IR+PHA680632 and IR alone vs IR+PHA680632 (P<0.0001). (B) Western blots showing p53 protein expression 48 h after siRNA p53 or non-specific targeting control siRNA transfection in A549 cells. DMSO vs PHA (P=0.6444). (C, D) Clonogenic survival after exposure to 200 nM PHA680632 and IR in siRNA control (left) or siRNA p53 (right) transfected A549 cells. DMSO vs PHA (P<0.0001).

