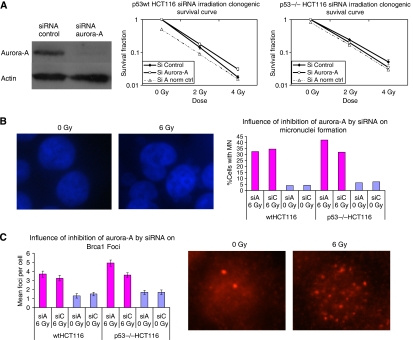
Figure 5.
Influence of Aurora-A inhibition by siRNA in response to IR in p53wt vs p53−/− HCT116 cells. (A) Western blot showing expression of Aurora-A 24 h after siRNA Aurora-A transfection compared with the non-specific targeting siRNA control; clonogenic survival of p53wt (left) or p53−/− (right) HCT116 cells transfected by siRNA Aurora-A or siRNA control; 24 h after transfection, cells were irradiated at indicated doses. Data represent the mean of three independent experiments in triplicate, and error bars represent s.d. (B and C) Aurora-A inhibition by siRNA influence on IR-induced micronuclei (B) and Brca1 foci formation (C) in p53wt HCT116 and p53−/− HCT116 cell lines. The percentage of cells with micronuclei (24 h after irradiation) in the p53−/− and p53wt HCT116 cells transfected by siRNA Aurora-A (siA) or siRNA control (siC) and then irradiated to 6 Gy is represented (B). There is a significant difference between siA 6 Gy and siC 6 Gy in p53−/− HCT116 (P=0.0018), while no difference was found in p53wt HCT116 (P=0.5102). No difference has been observed in siA and siC without irradiation (P=0.8746 for p53wt HCT116 and P=0.614 for p53−/− HCT116). Immunofluorescent images of micronuclei after 6 Gy (or 0 Gy) in p53wt HCT116 cells (B). The mean BRCA1 foci (4 h after irradiation) number per cell are shown (C) in the p53−/− and p53wt HCT116 cells after transfection by siRNA Aurora-A (siA) or siRNA control (siC) and IR (24 h after transfection of siRNA, 6 Gy). Representative fluorescence microphotographs (Brca1 foci after 6 or 0 Gy) are shown in p53wt HCT116 cells.

