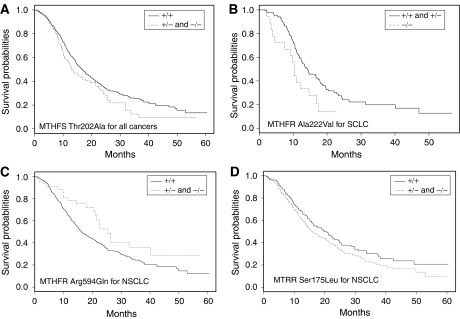
Figure 2.
Kaplan–Meier curves for lung cancer patients. (A) Relationship between MTHFS Thr202Ala genotype and prognosis from all lung cancer; (B) relationship between MTHFR Ala222Val genotype and prognosis from SCLC; (C) relationship between MTHFR Ala222Val genotype and prognosis from NSCLC; (D) relationship between MTRR Ser175Leu genotype and prognosis from NSCLC. The solid line depicts the survival curve for the reference group. +/+, +/− and −/− refer to the common homozygotes, heterozygotes and rare homozygotes, respectively.

