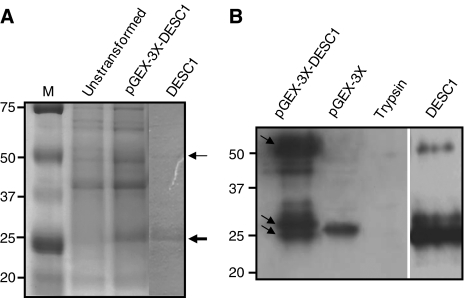
Figure 1.
Production of recombinant DESC1. (A) Untransformed BL21(DE3)pLysE E. coli cells (lane 2) and cells transformed with pGEX-3X-DESC1 after IPTG induction (lane 3) or purified DESC1 (lane 4) were analysed by SDS–PAGE. The sizes of molecular weight marker (kDa) are indicated on the left (Lane 1, M). DESC1 fused to GST is indicated with a thin arrow. Position for DESC1 released from GST is indicated with a thick arrow. (B) Western blot analysis of the proteins using the anti-DESC1 antibodies generated in this work. Fused GST+DESC1 protein (50.4 kDa) and released GST (26 kDa) and DESC1 (25.4 kDa) are indicated with arrows (lane 1). The generated antibodies detect GST expressed alone (lane 2), but not trypsin (lane 3). Lane 4, purified products eluted from a glutathione-Sepharose 4B column.

